Friday belonged to the sellers. The S&P 500 lost 1.82% to about 7,580 after touching 7,527 during the session, the Dow fell 1.09%, the Nasdaq Composite dropped 2.86% to its lowest close since the end of July, and the Russell 2000 gave up 1.66%. Technology led the way down after a second evening of weak earnings, with Intel delivering one of the poorest reports of the season, and the Philadelphia semiconductor index fell 7.2% to close under its 200-day moving average for the first time since early 2025. Treasuries barely moved because the flight out of equities met a 2.4% jump in Brent, as traders position for a resumption of strikes on Iran despite Qatari and Pakistani mediation efforts. Gold fell about 3.5% and silver more than 5%, so the usual havens offered no shelter.
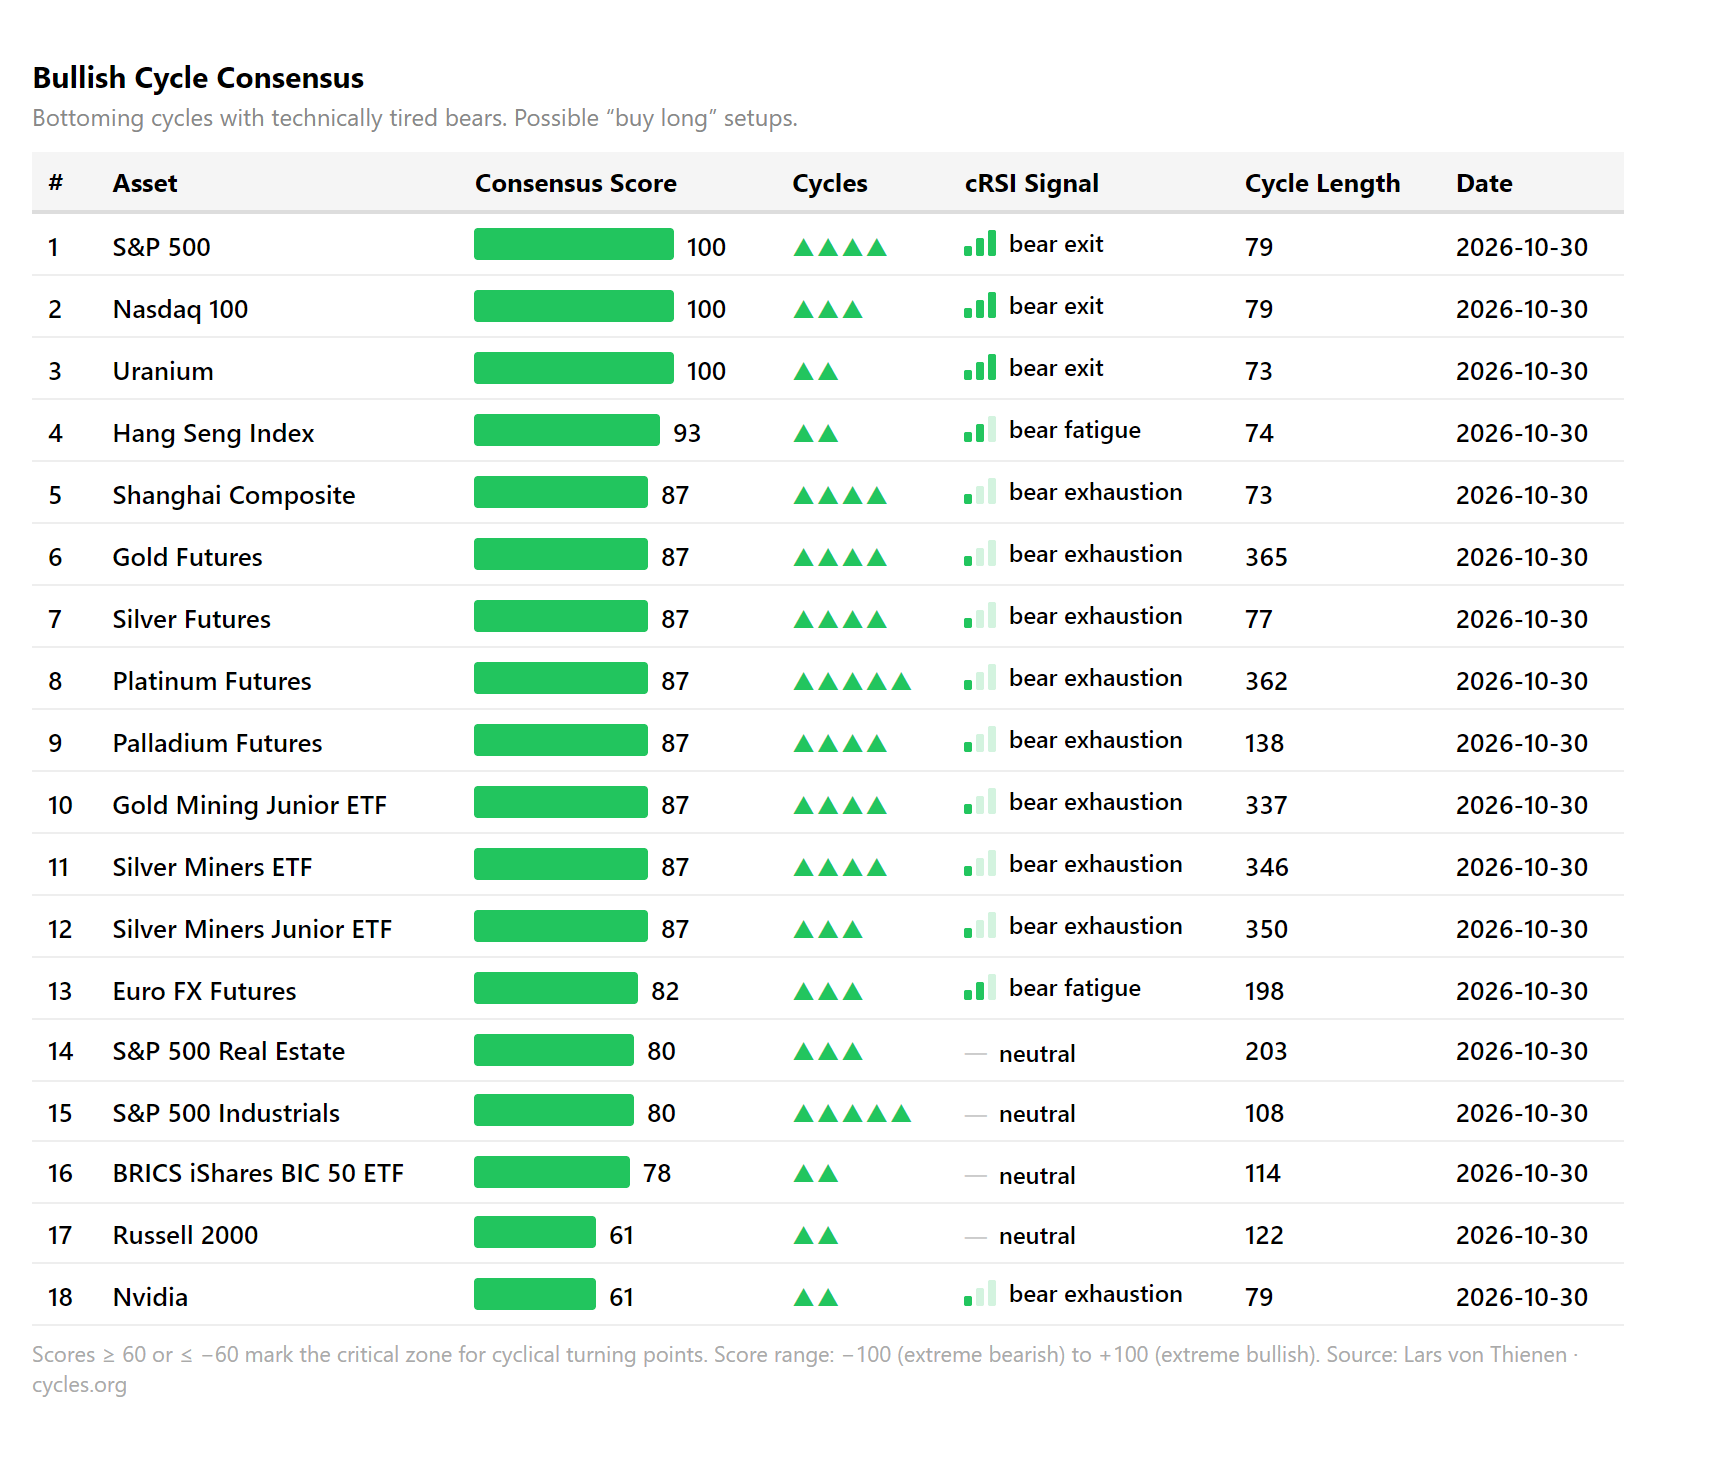
Two threads ran through the session. The first is financing. The AI build-out is funded largely in the capital markets, so a slide in technology multiples feeds back into how much capacity gets built, and a press report on Friday afternoon that Anthropic may not receive an investment-grade rating straight after its planned listing pushed the S&P 500 to its low of the day. The second is policy. Two regional Fed presidents called for further tightening on Friday, and the coming week carries the midterm elections on Tuesday, the Treasury’s refunding plan with talk of retiring the 20-year bond, Apple’s results on Monday evening and the October jobs report on Friday. Under that tape our cycle model puts the S&P 500 and the Nasdaq 100 at its highest possible floor reading, a level neither index has reached since this series began in April, and moves the energy sector, which closed at a multi-year high on Friday, onto its ceiling list.
The day’s reading is a divergence, and it runs both ways. The S&P 500 and the Nasdaq 100 carry the model’s strongest floor reading of +100, which means the cycles behind both indices have bottomed together and the model treats the decline as close to finished. The prices say otherwise for now, because both indices closed Friday at their lowest levels in weeks and the metals at their lowest in a year. On the other side the energy sector closed at a multi-year high on the very day the model moved it onto its ceiling list, a reading that says the rise could stall from here. In plain terms, the cycles call a floor under US equities and a ceiling over energy, and Friday’s tape disagreed with both.
The record behind such disagreements is dated. On April 8 the Nasdaq 100 carried the same combination, a reading near the top of the floor scale with a momentum signal that the selling had ended, and the index rose 25% from that close to its October 6 high, the S&P 500 15%. The energy floor flagged on July 11 at the model’s strongest floor reading has paid 28% to Friday’s close, and the same 162-day cycle that carried that floor sits at its peak now, 83 days after the last floor reading, half its length later. The DAX floor flagged on October 21 paid 5.0% to Thursday’s close, its highest since September 4, and the real-estate floor from October 3 has paid 6.0%. The long-bond ETF flagged on October 7 and confirmed on October 14 closed Friday at its highest since September 8, 6.1% above its October 5 low. Not every call has paid, and the uranium floor shown on Wednesday as finished gave back 7.7% in two sessions to its lowest close since June 2025, while the metal floors from mid-October and the Hang Seng floor from October 10 still sit below their call levels. The model does not promise, it alerts, and a top floor reading on a down day is exactly the moment to watch for the first higher close.
Our daily scan runs about 45 global markets through the cycle engine and condenses each into a Consensus Score, the model’s measure of how far the dominant cycles agree on a possible turn, from minus 100 for a possible top to plus 100 for a possible floor. Readings beyond plus or minus 60 enter the critical zone, a critical reading at which the cycle model raises the alarm for a possible turn. Let’s take a closer look.
Bottoming cycles