


Friday closed a week in which the technology trade kept losing altitude. The Nasdaq Composite finished at 25,955, down 0.2% on the day and 6.0% below its October 6 high, the S&P 500 lost 0.5% to
7,624 and the Dow gave back 1.2% to 52,215. The semiconductor index managed a 0.4% gain on Friday and still closed 18.5% below its October 6 high. Solid results from the AI-linked names found no lasting buyers, because the market has moved on from this year’s numbers to the question of how the data-center build-out will be financed from here. Oil was the other focus. WTI crude rose 3.8% to $103.27 as the security situation in the Middle East deteriorated again, and the S&P 500 energy sector closed at its highest level in more than two and a half years. The flash purchasing managers’ surveys paired healthy demand with the strongest price pressures in years. In the metals, gold fell 1.3% to 4,007.90, its lowest close since mid-July, and silver lost 1.9% to 53.71. The coming week brings the Fed on Wednesday, the ECB and the Bank of Japan on Thursday, the first estimate of third-quarter GDP and the heaviest earnings days of the season.
Beneath that tape the cycle board shows two faces. On the rate side, the warning of a top in yields that the model has carried since the start of October has turned into price. The twenty-year Treasury yield now holds the model’s strongest ceiling reading of -100, the bearish maximum, and on Thursday the yield fell to 5.32%, its lowest close since September 9. Its momentum gauge reads bull exit, the bulls leave the field and the upswing in yields appears finished. For a trader that is the model saying the rise in yields is done for now and a decline is under way, and the long-bond ETF, which moves the other way, has already gained 6% off its October low. The other face is the floor side. The model keeps calling floors in gold, silver, platinum, the Hang Seng and Shanghai, yet on Thursday and Friday all of them closed at fresh lows for this move, and the Nasdaq Composite joins that list after a 6% slide. Their momentum reading is bear exhaustion, the decline is stretched like an overextended rubber band, which says the selling has overshot but has not stopped yet. In plain terms, the model still sees floors there and the price has not agreed, and an overstretched decline can run further before it turns.
The record behind the rate call is dated. The twenty-year yield has sat on the model’s warning list since October 3, when the ten-, twenty- and thirty-year yields entered the zone together. The warning deepened on October 10 and October 14, and the first bull exit printed on October 17. From its October 7 high of 5.71% the yield has fallen 0.39 percentage points to Thursday’s 5.32%. The long-bond ETF TLT reached the bullish maximum on October 14 and has gained 6.0% from its October 5 low of 77.11 to Thursday’s 81.74, its highest close since September 22, and its reading has now eased out of the zone, the usual course once a turn has paid. Natural gas, where the model warned of a ceiling on October 3 and repeated the warning with a bull exit on October 21, closed Friday at 2.640, 19.9% below its September 24 high and 10.9% below the Tuesday close that the October 21 article carried. The Russell 2000 floor, told on October 21 with the 121-day cycle at its trough, has its first price answer, Friday’s close of 2,775.90 stands 2.0% above the October 16 low. The real estate round trip told on October 17 keeps paying, the sector closed Friday at 271.41, its highest close since September 22 and 4.5% above its October 7 low. The calls still waiting for a price answer are the metals and the Hang Seng. Gold closed Friday 2.4% below its October 14 close, the day its floor reading first reached the bullish maximum, and the Hang Seng closed Friday 4.6% below its close on the day of the October 10 floor call.
Every day we run roughly 45 markets through our cycle consensus engine, which condenses the cycles behind each market into one Consensus Score between -100 and +100, the model’s summary reading for a possible turn. A positive reading marks a time window in which a decline could end, a negative reading a window in which a rise could stall or reverse. Readings beyond ±60 enter the critical zone, where the model raises its alarm for a possible turn, and only those markets appear in the tables below. Let’s take a closer look.
Bottoming cycles
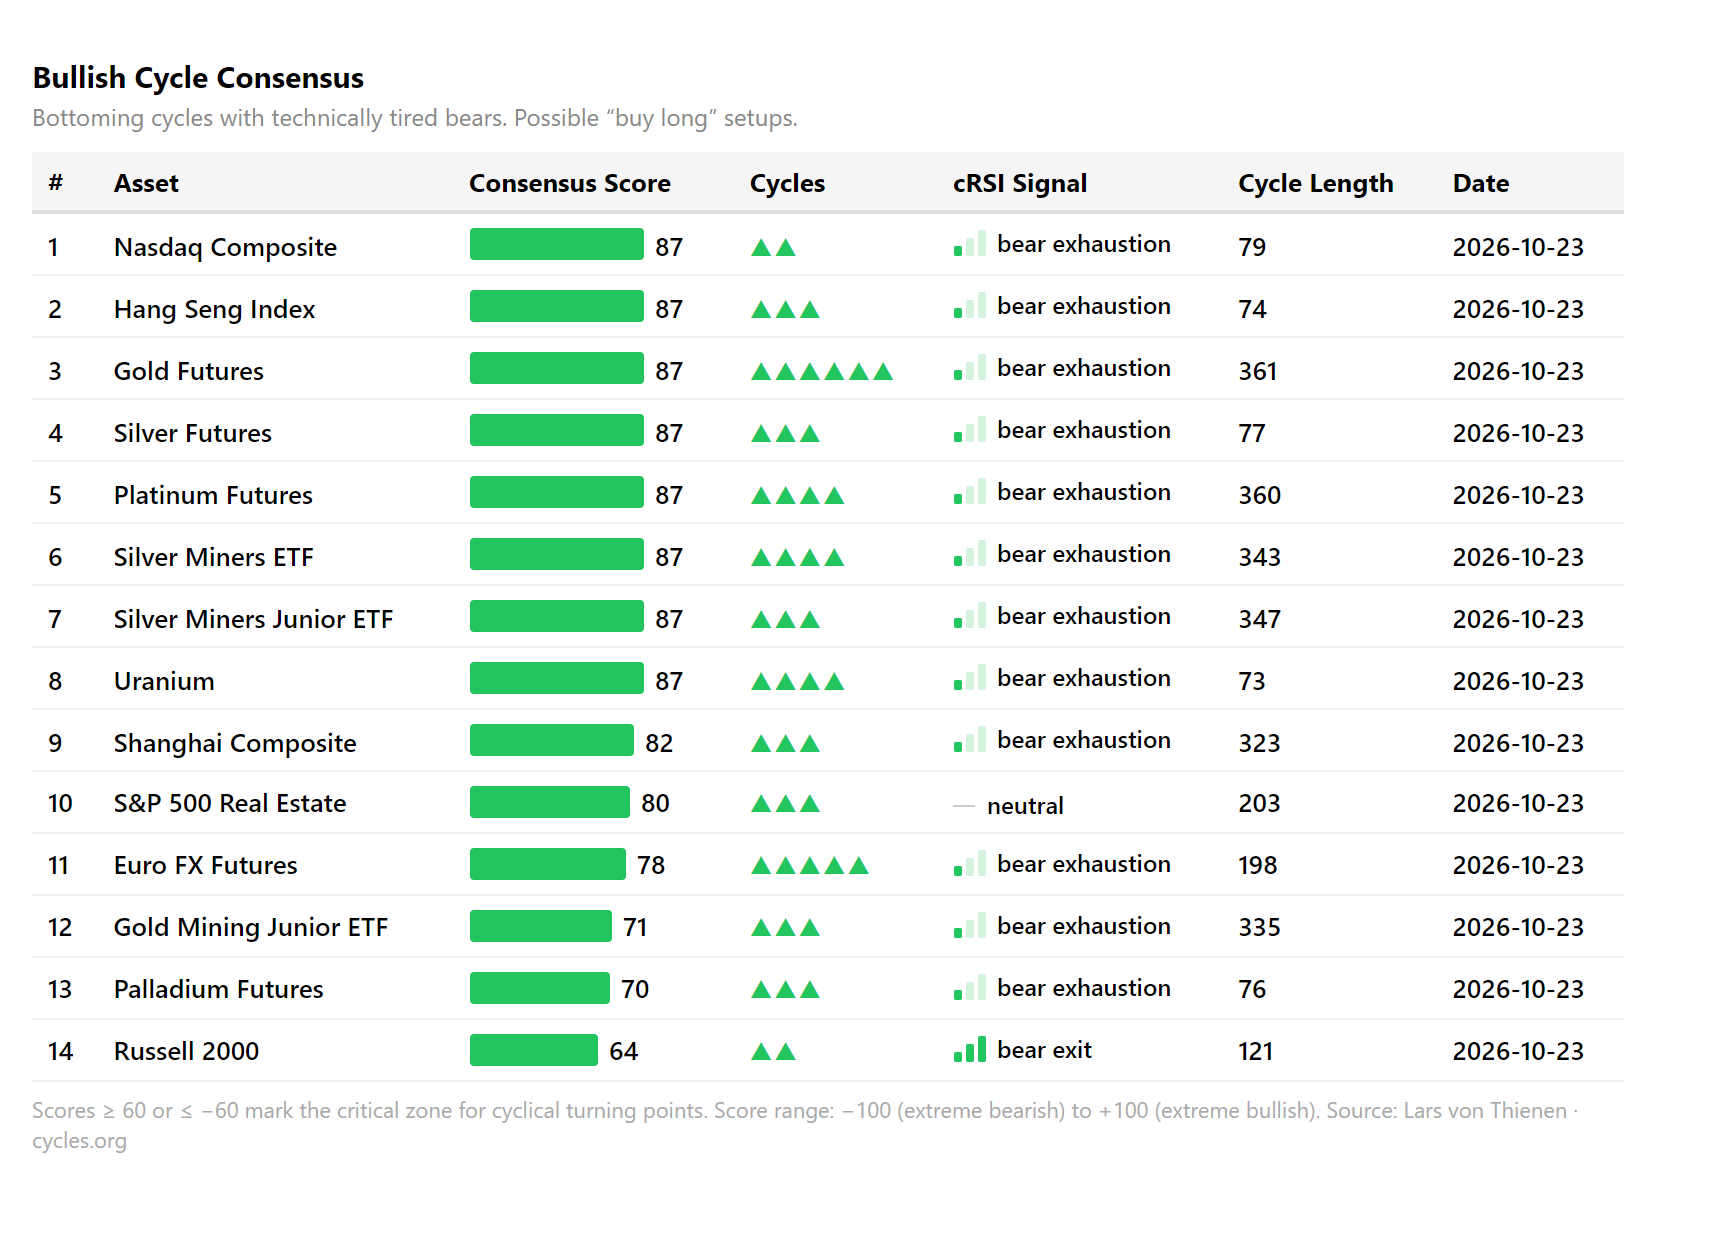
Let’s start where markets may be finding a floor.
